Research Update on Geomembranes at Tailings Storage Facilities
August 08, 2017
Geology or ground models are critical elements of engineering or geoscience design. They define the interaction between the built and natural environments.
The built or engineering environment is two-dimensional, consisting of straight lines and formed curves. It is a consistent, patterned design, that is regular and conforms to mathematical summation.
The natural environment (geology) is three-dimensional and inconsistent in form and continuity; variation and change are everywhere and affect every component of the system. Randomness does not work well with engineering design, and order and simplicity do not usually apply to geology.
However, great success in modelling the natural environment occurs when these aspects are integrated in an efficient and defensible manner.
Gridding algorithms are mathematical processes that read irregularly distributed data and convert these into a regularly spaced array. In simpler terms, the process converts drill hole contacts to a format that can be converted to wireframes, geological models or block models, which in turn inform many of our analyses and interpretations.
It is our role as professionals to select an appropriate algorithm that balances aesthetic visualization with the defensible representation of the data. When the wrong algorithm is selected this results in unrealistic data construction that is difficult to identify and is time-consuming and frustrating to correct.
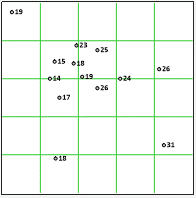 The following drill hole data (left) was contoured using three algorithm methods: triangulation, minimum curvature and kriging.
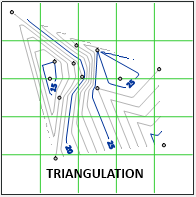 The triangulation algorithm uses lines to create triangles between data points. Triangulation results are blocky and abrupt, yet often best reproduce the original data.
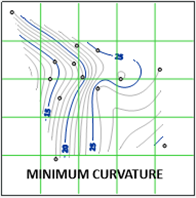 Widely used in earth sciences, minimum curvature generates a smooth interpolated surface from the data points. Minimum curvature results honour the original data while achieving smoothed contours.
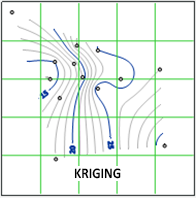 Kriging is a geostatistical gridding method used to express trends suggested in the data. Kriging results include troughs and peaks and smooths the areas of limited data. Where base data is sparse or geological contacts are abrupt, kriging can skew the data.
As a starting point, the minimum curvature algorithm is a good all-rounder. Apply a moderate grid density, by aiming initially for 10,000 nodes (or 100 x 100). Always compare the constructed surface with the original data by running a “residuals check” to assess the algorithm’s performance. In areas of sparse data, create sections or view the data to check for algorithm-generated troughs or peaks.